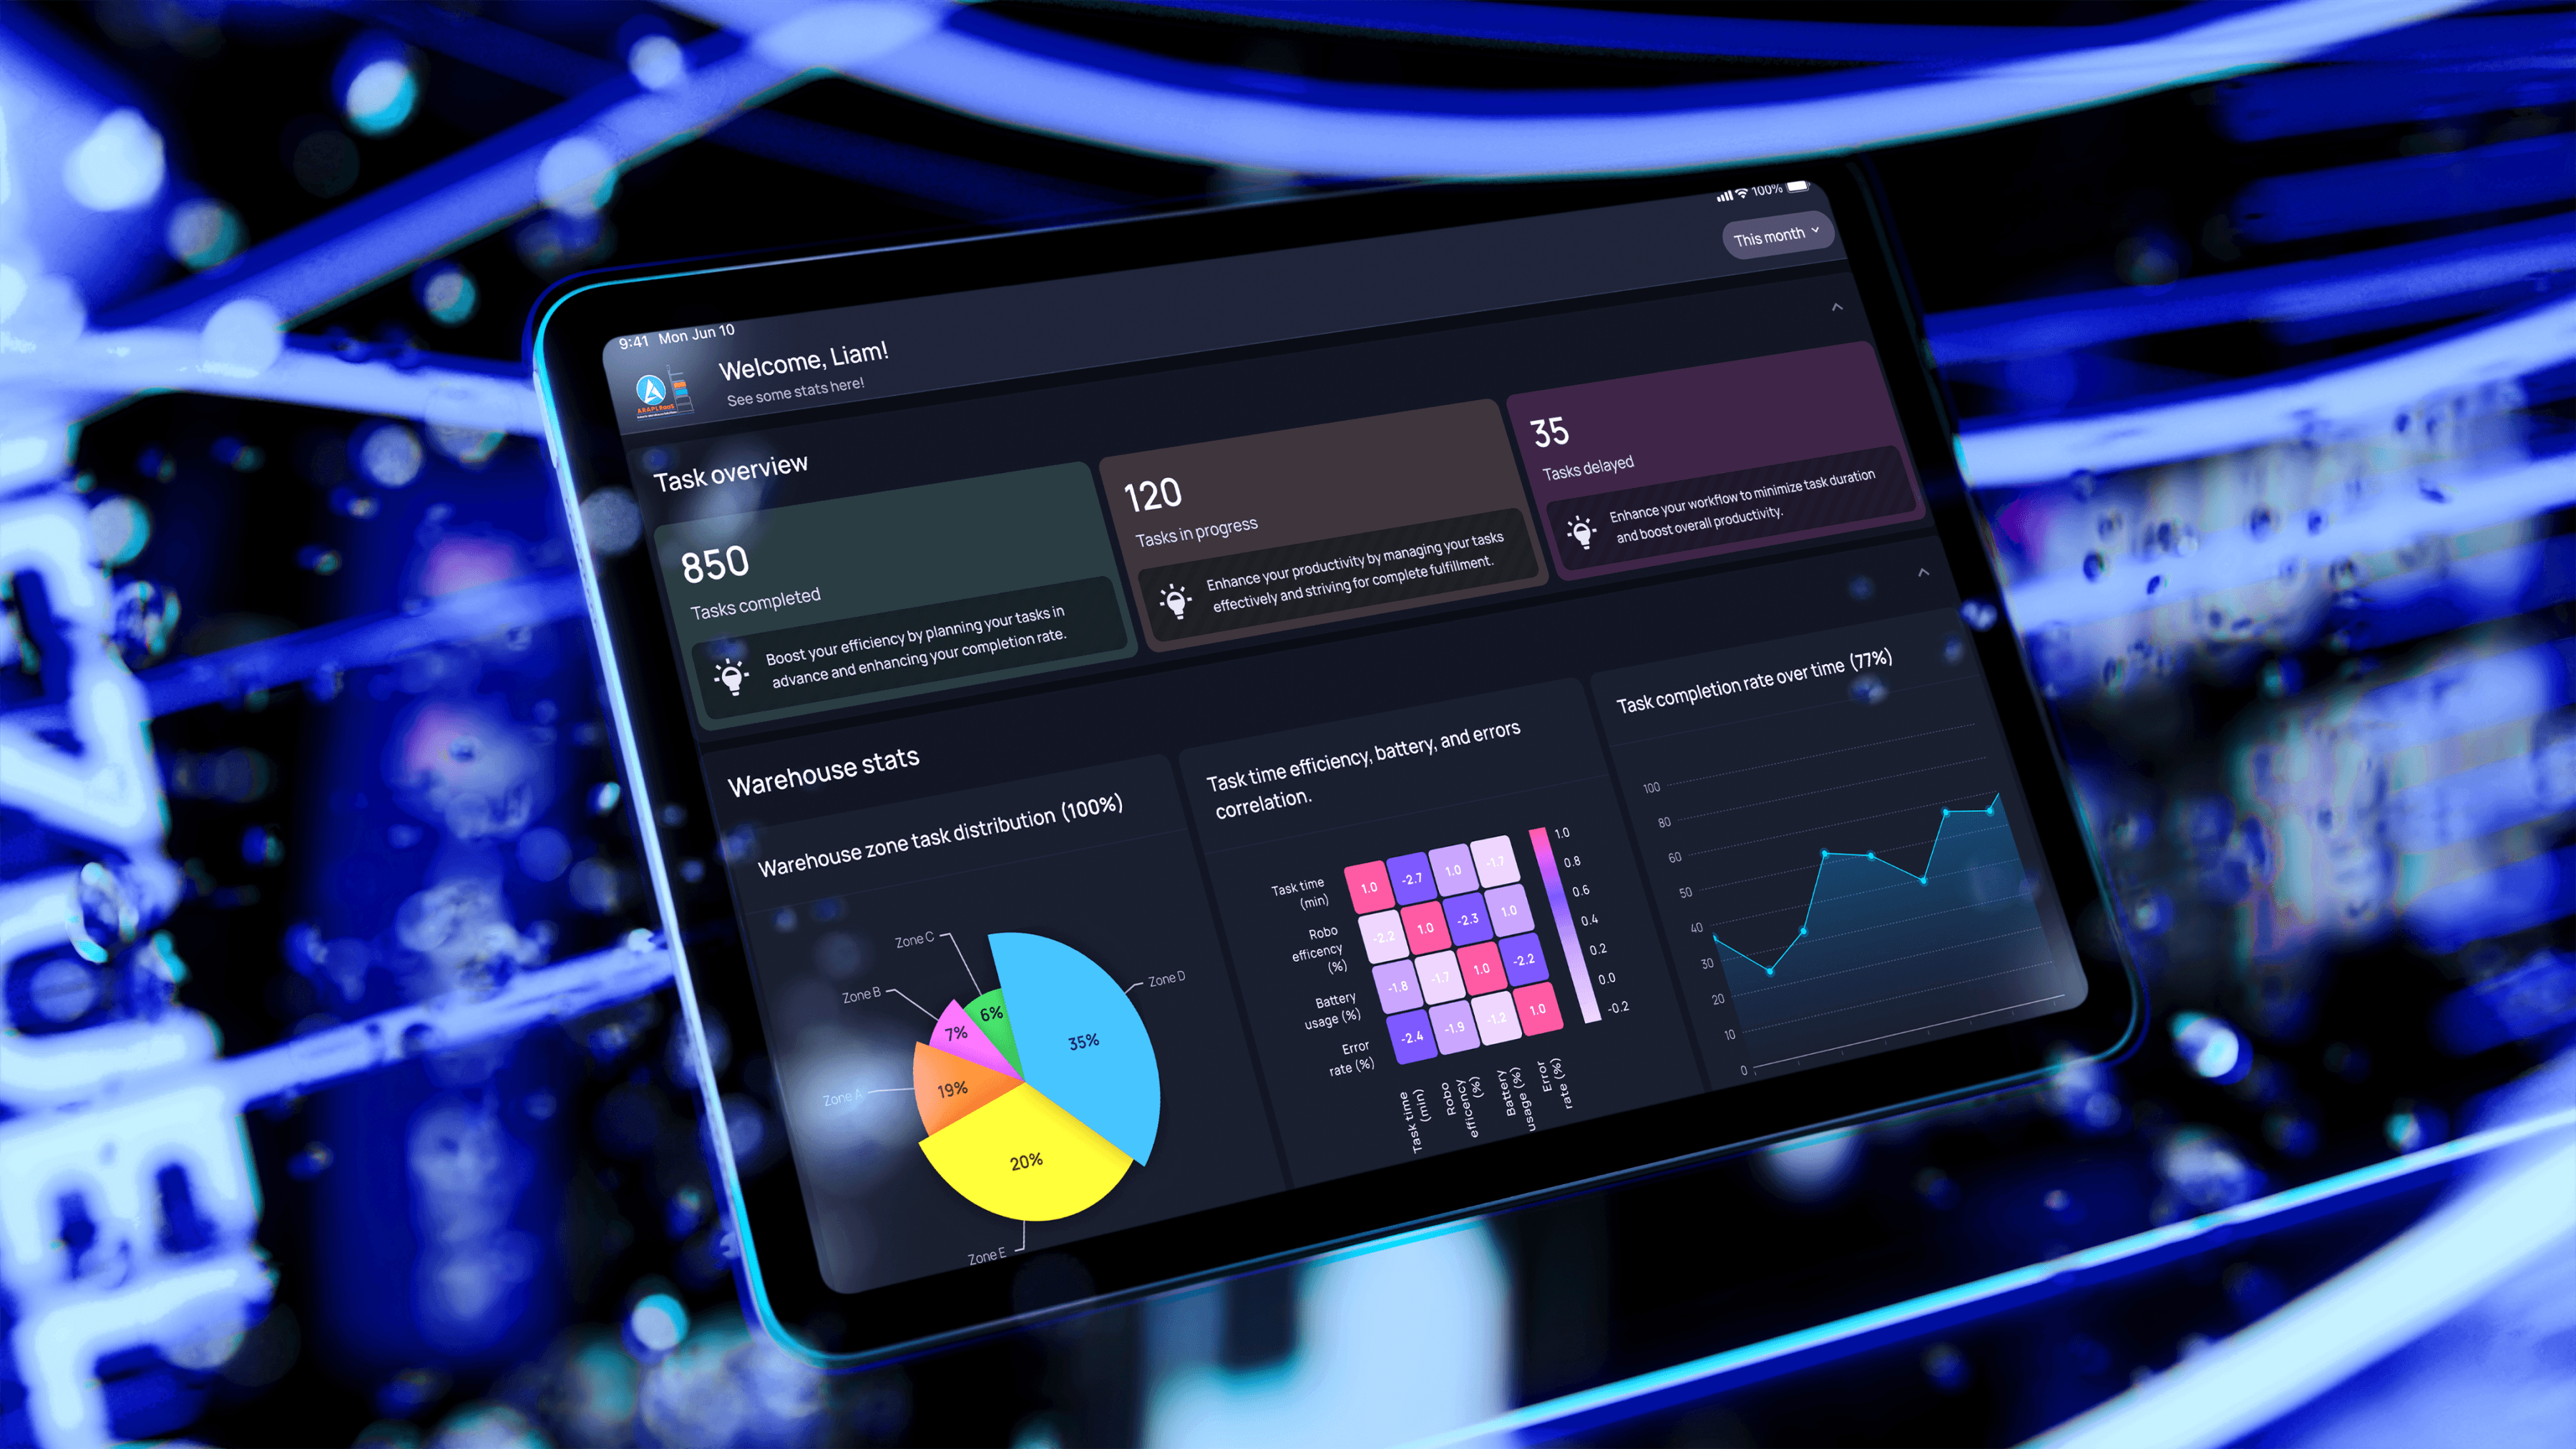
ARAPL RaaS came to us with a question:
Our answer: turn a status-screen-shaped app into a control surface a supervisor could actually run a shift on — learnable without a manual, alert to the physical floor, and structured enough to white-label across clients.
My Role
UX Designer, Researcher, Product Designer
Team
1 UX Designer, 1 UI Designer, 1 Team Lead
Timeline
2 months
Overview
ARAPL RaaS is a white-labeled control plane for autonomous warehouse operations; the software supervisors use to set up sites, dispatch robots, run tasks, and respond when something on the floor needs attention.
Over two months I led UX across new modules and a redesign of existing screens, with one core constraint: every decision had to assume a physical operation on the other side of the click.
PROCESS
How we got here
01
Understand
Walked through ops, footage, and existing flows.
02
Research
Talked to operators & supervisors about what breaks.
03
Principles
Locked the tie-breakers used downstream.
04
Map
Sitemap and the three core flows.
05
Design
5 modules + the white-label layer.
THE STORY
From a status app to an operations layer


Control Surface
for Live Operations
CREATE TASK
Task creation as a template, not a form
Treat task creation as a structured template, not a form. Supervisors create dozens of tasks per shift, often under pressure. A traditional form would either expose too much or hide too much. We split the difference.
Templated task types
A supervisor picks "morning drop off" and inherits sensible defaults; when repetitions are upfront - deviations are explicit instead of buried.
Problem solved
Problem solved: Every task configured from scratch; inconsistent setups, forgotten fields, avoidable errors
Validation
Reduction in misconfigured tasks; time-to-launch drops for recurring task types


Bite-sized steps
Interactive truck layouts
For standardised trucks. Loading positions picked visually instead of typed, or selected by name.
Problem solved
Typed position inputs led to entry errors and misloaded trucks
Validation
Drop in position-related loading errors reported post-deployment.


Visual location availability & Flattened 3D structure of the warehouse
Inline availability on a flattened 3D structure — no flipping screens to check if a slot is free.
Problem solved
Supervisors had to cross-reference a separate system to verify slot availability before assigning.*

TASK LIST
The task list is a control surface, not a list
Treat the task list as a control surface for the whole floor. The supervisor needs to see what's happening across the warehouse without scrolling or digging. The Task List view collapses five jobs into one screen.
Task type, status, robot count, and operations at a glance
The answer to "what and how are tasks running right now?"; easily available.
Problem solved
Supervisors had to navigate into the system to understand current state — awareness lagged behind reality.
Validation
Faster supervisor response to anomalies; fewer escalations from missed status changes.


Upfront error handling
What’s burning doesn’t get hidden. Navigating to failed robot ot troubleshooting is available on fewest possible clicks.
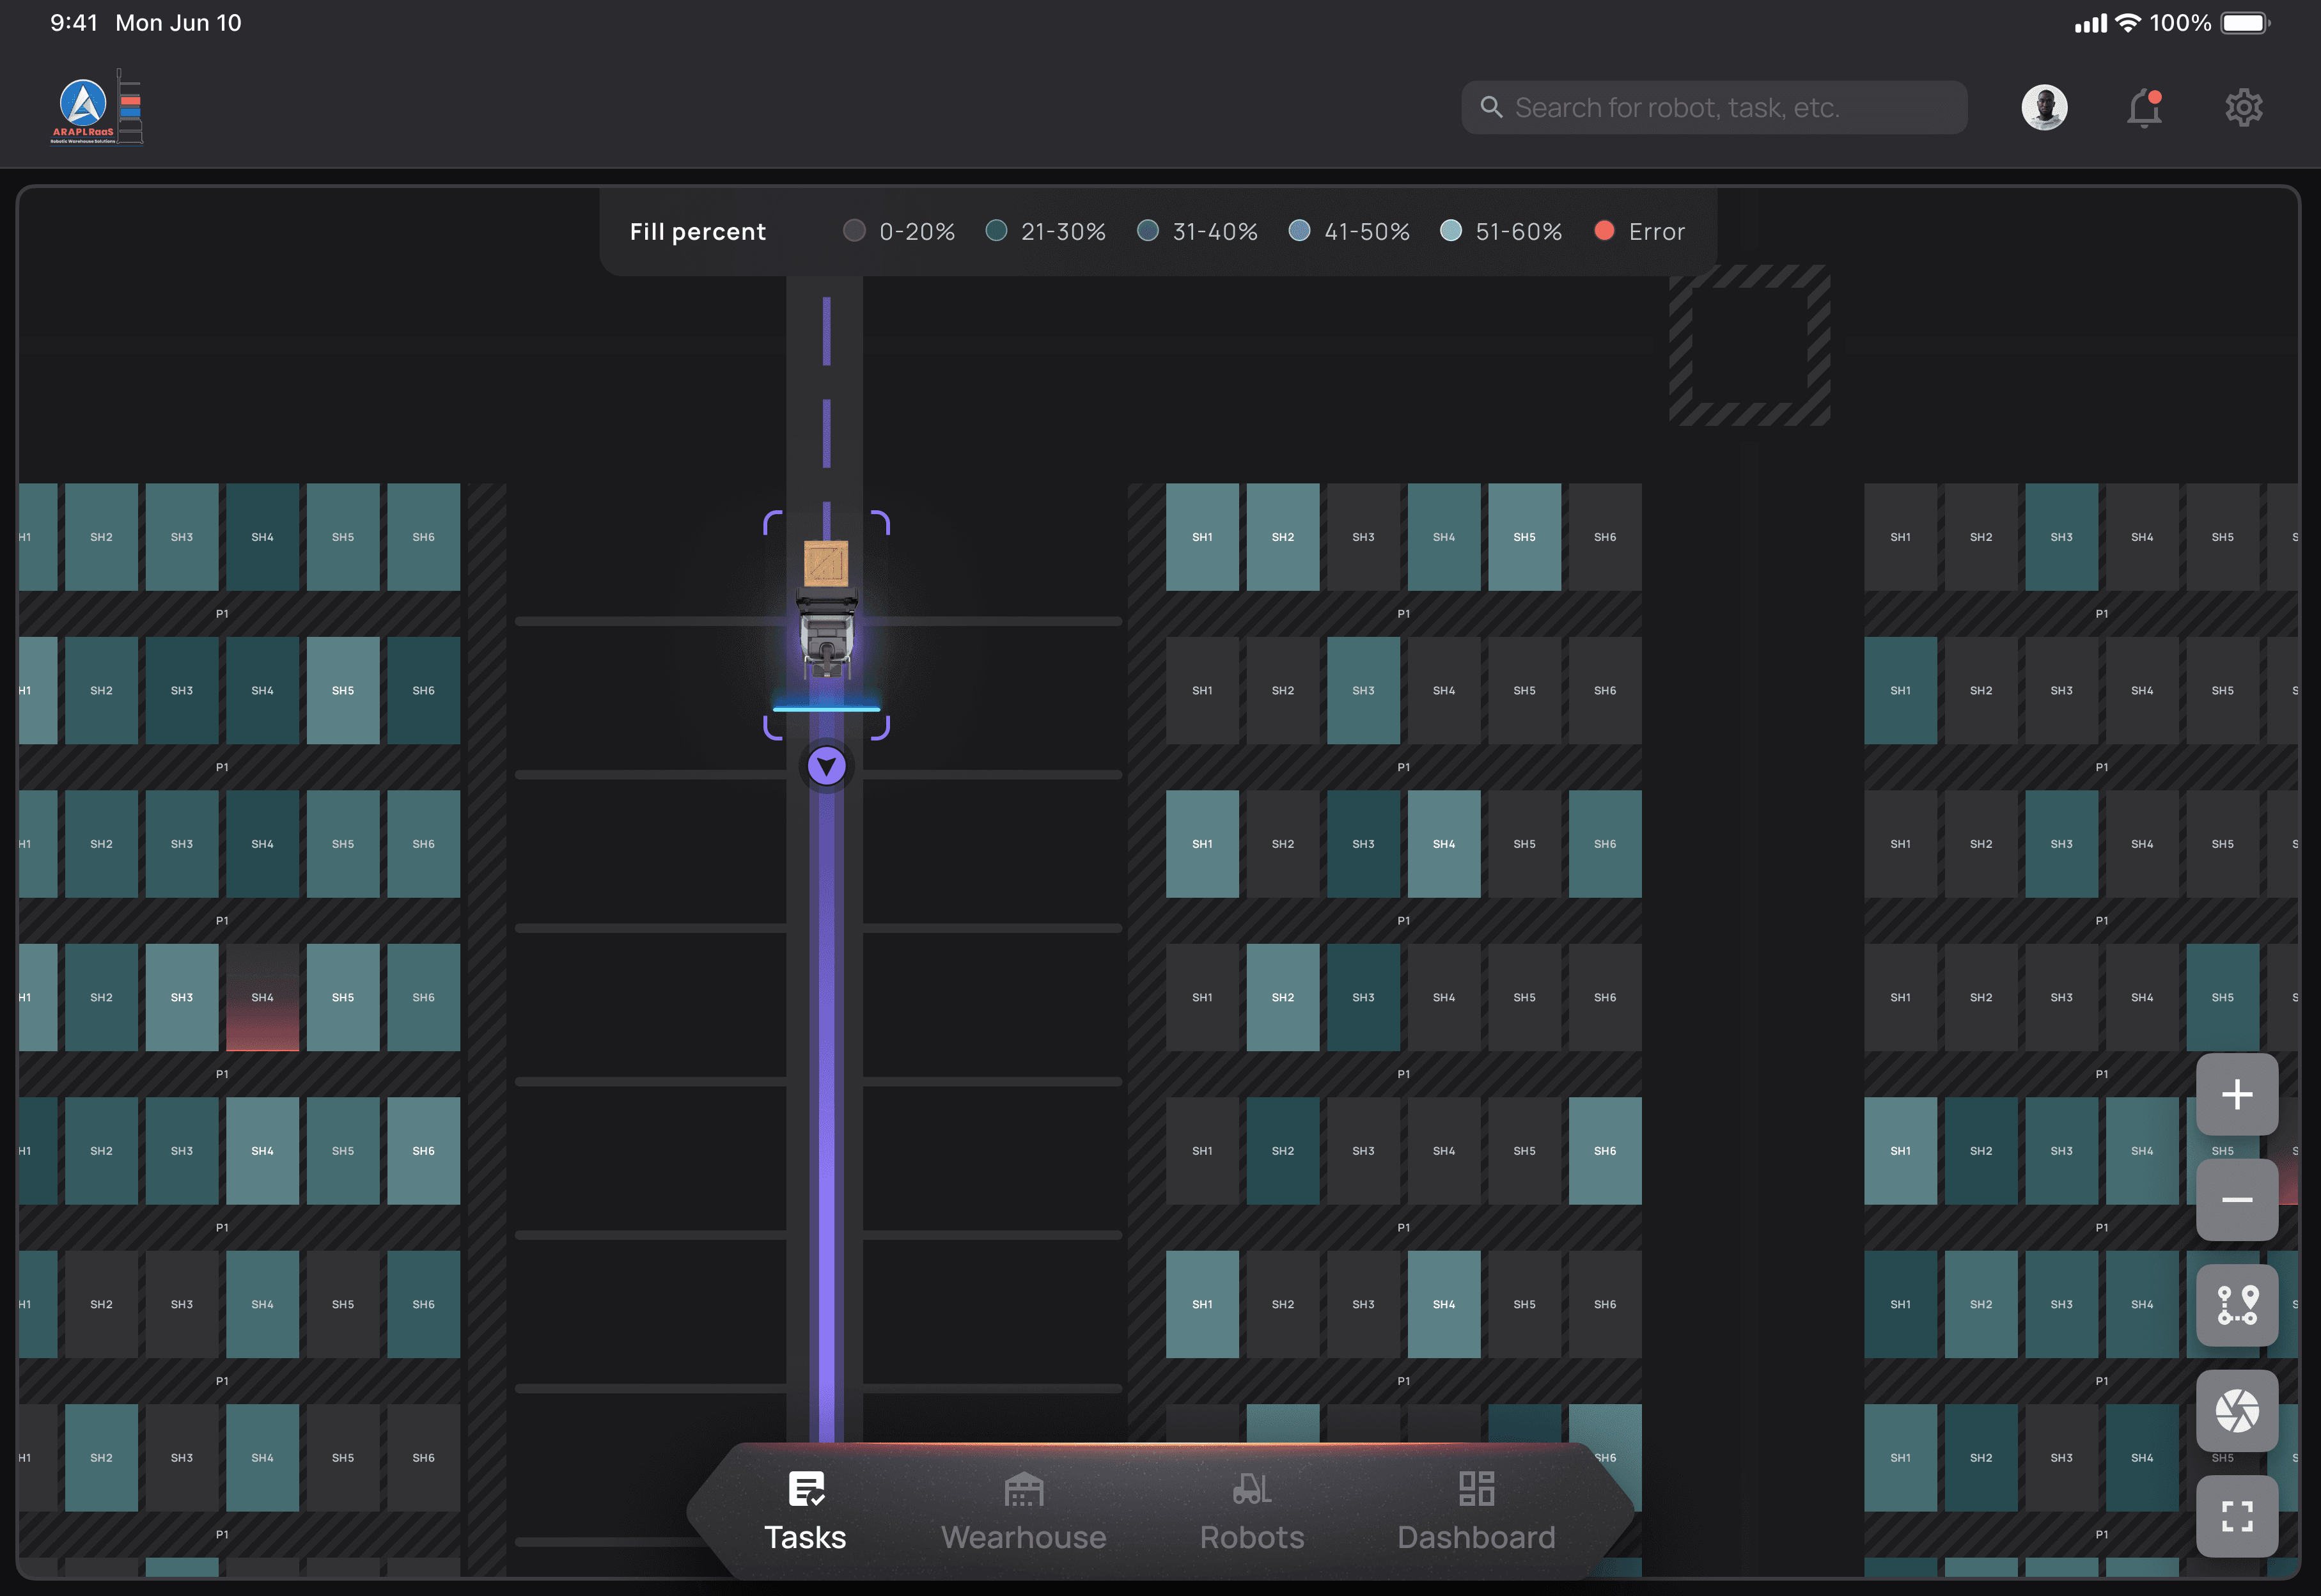
Movement monitoring and bird's-eye view
Live robot positions overlaid on the warehouse map.
Problem solved
Robot locations existed only as list data — supervisors had no spatial sense of where congestion or stalls were forming.


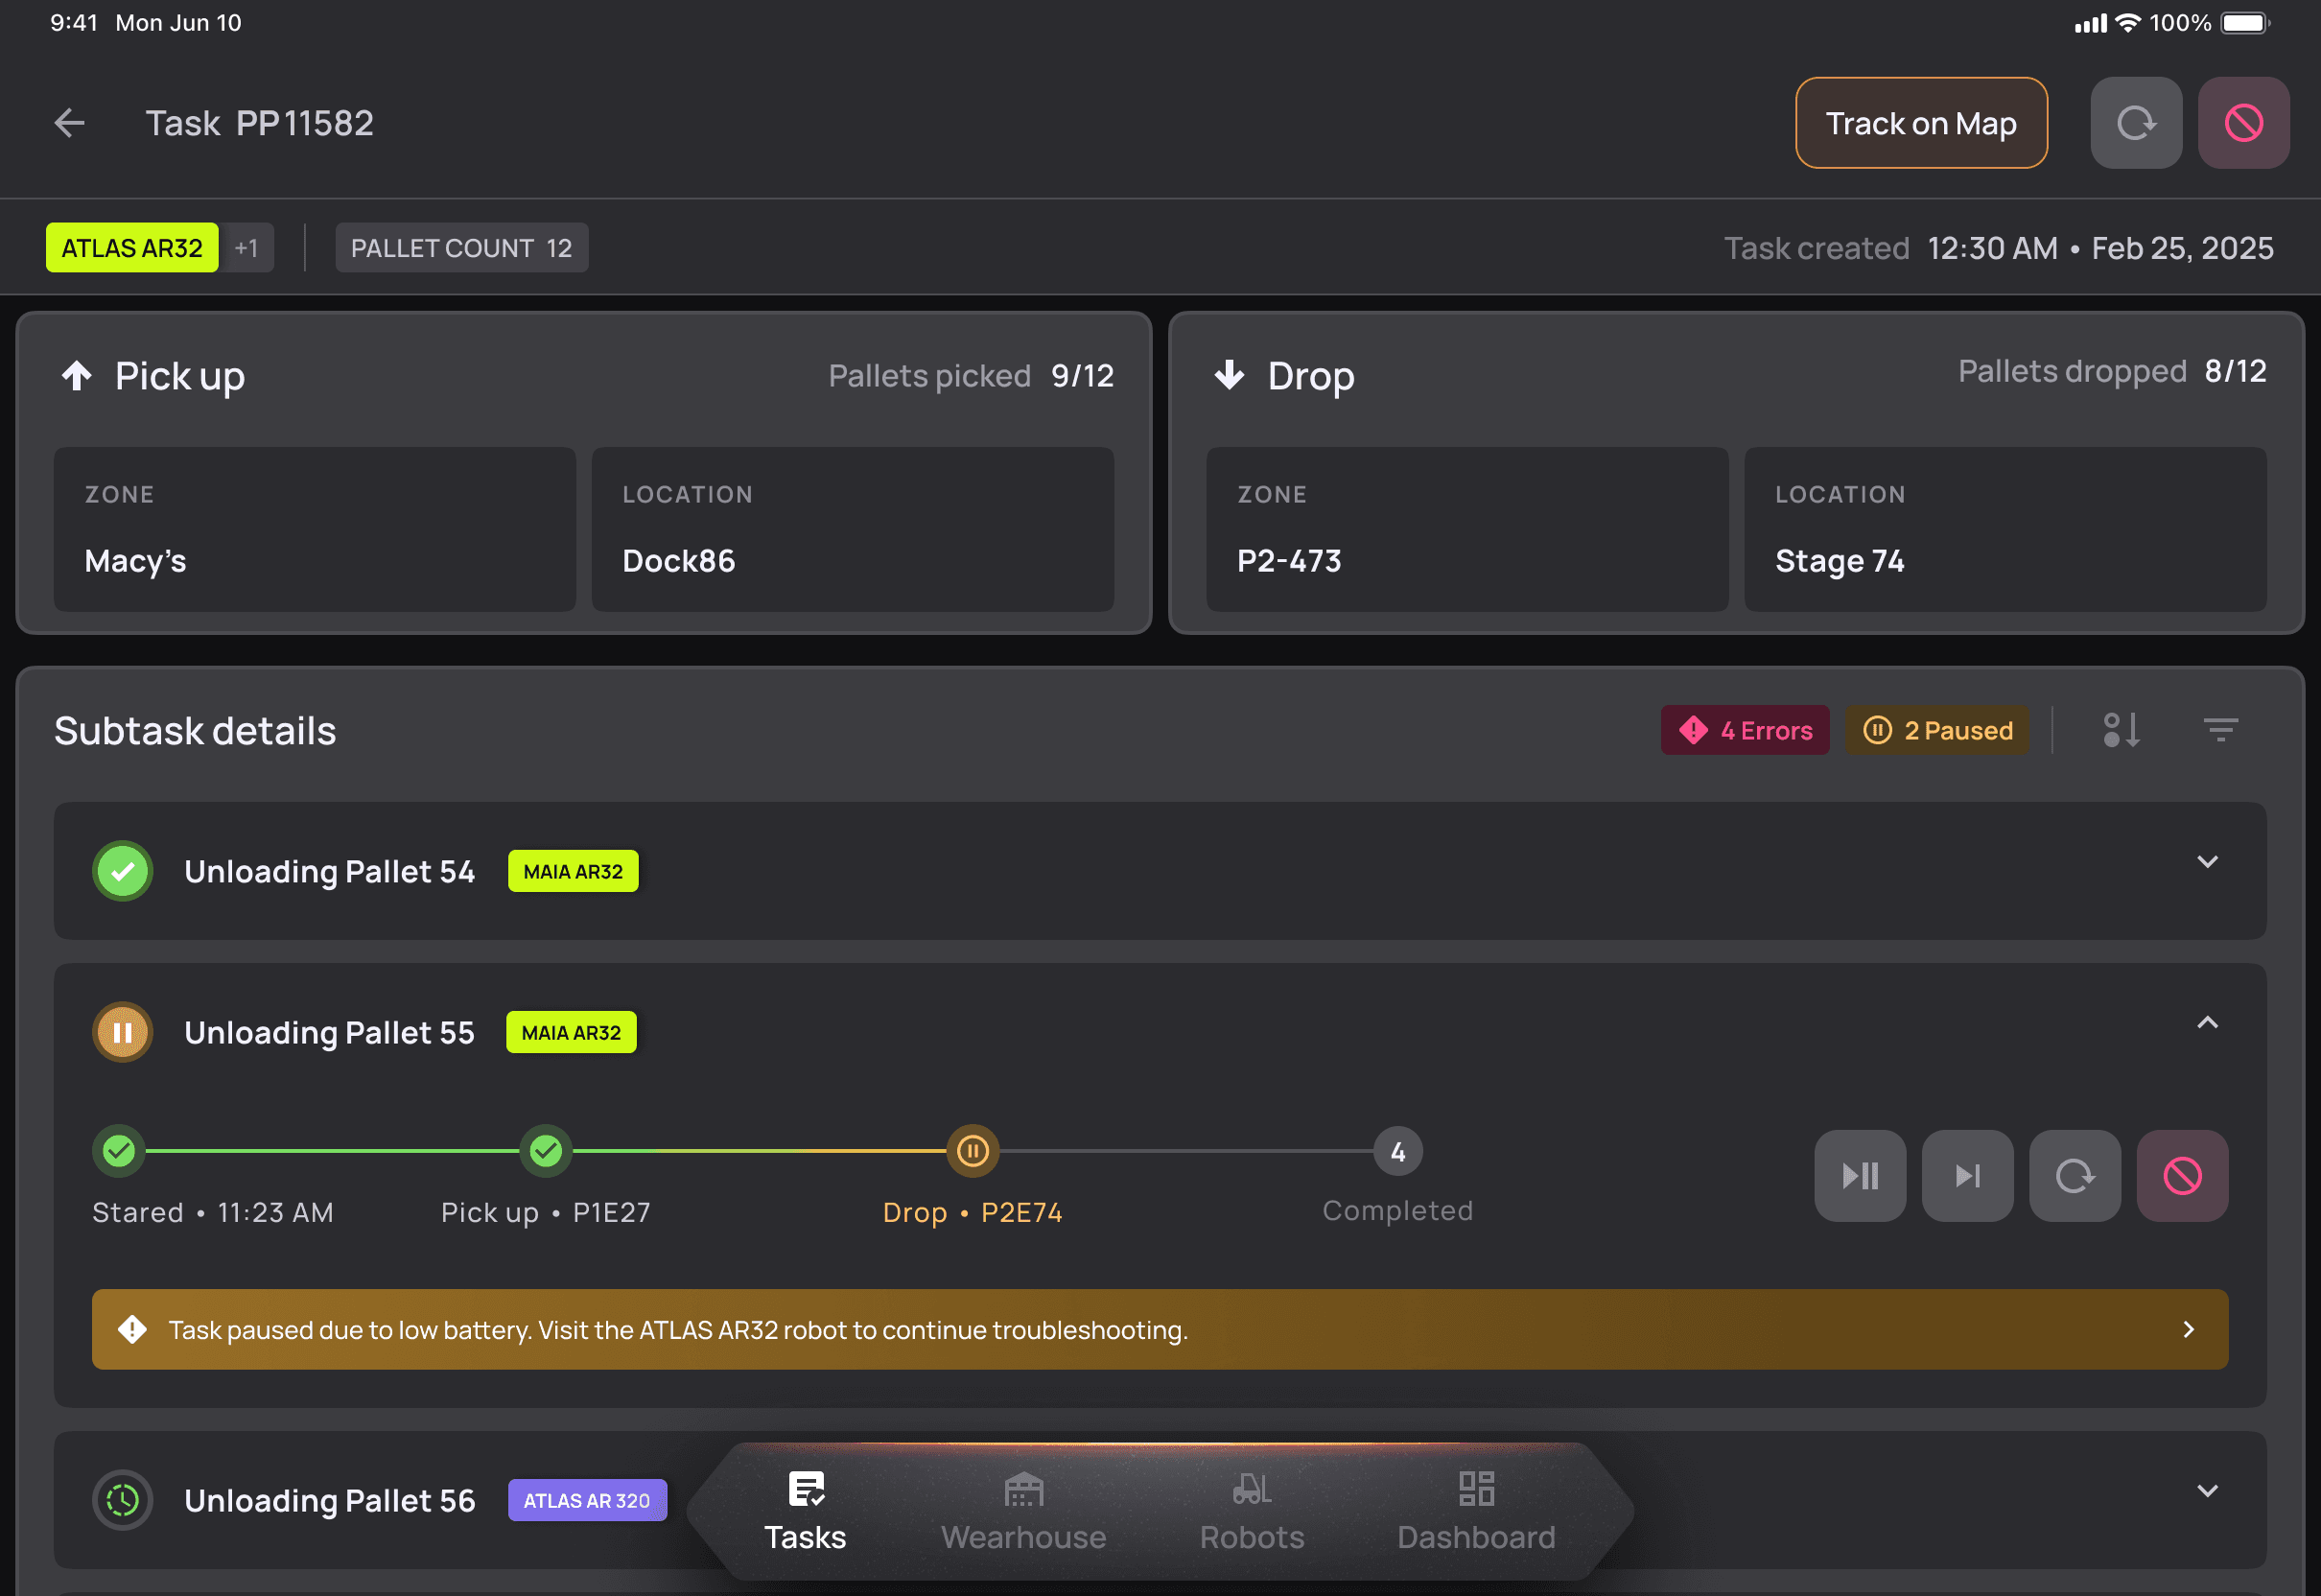
Task → subtask hierarchy
Status and management at whatever level of detail the situation needs.
Problem solved
Flat task lists obscured whether a delay was task-wide or isolated to one step
Validation
Faster diagnosis of where a task has stalled; less time spent on status calls.
Map View

ROBOT HEALTH
Robot health is a Kanban board, not a status page
Surface the one robot that needs attention — don't make a supervisor read top-to-bottom. Status pages assume you read top-to-bottom. Supervisors don't. They scan for the one robot that's off. Kanban-by-status answers the only question being asked.
Kanban overview by status
Columns for active, idle, charging, needs attention. One glance tells the supervisor where to look.
Problem solved
Fleet status required opening individual robot records — no way to see the full picture at once.
Validation
Time to identify error-state robots drops; fewer robots left in error state or unattended.


Per-robot detail
Specs, current task, charging state, error context, and active task management on a single screen.
Problem solved
Diagnosing a robot issue meant pulling information from multiple places — by which point the situation had often worsened.
Per-robot error history
Supervisors recognize patterns (this robot stalls in zone B every Tuesday) and act on them.
Problem solved
Errors were addressed in isolation — recurring issues went unnoticed until they became serious.
Validation
Repeat error rate per robot decreases; preventive maintenance actions increase

Robot details

WAREHOUSE ONBOARDING
Setup as authoring, not configuration
Treat warehouse setup as a structured authoring workflow, not a config screen. Onboarding a warehouse means describing a physical space in software — racks, zones, docks, paths, exceptions.

Two input paths
Manual setup for small sites; Excel import for clients moving from spreadsheets. Same patterns are used for robot onboarding - so learning warehouse setup gets the client halfway to robot setup.
Problem solved
A single setup method excluded either small sites/fleets (too complex) or large sites/fleets (too slow)
Folder-like structure for complex sites
Configuration feels familiar, similar to a like a file tree.
Problem solved
Nested forms for multi-zone sites were disorienting — users lost their place and made structural mistakes
Validation
Reduced support requests during warehouse setup; time to complete multi-zone configuration.


Inline table editing
After bulk uploads errors are easily visible and solved in place.
Problem solved
Validation errors sent users back to the start — friction killed completion rates on large configurations.
Validation
Configuration completion rate improves; time spent in error-correction loops drops.
Dashboard
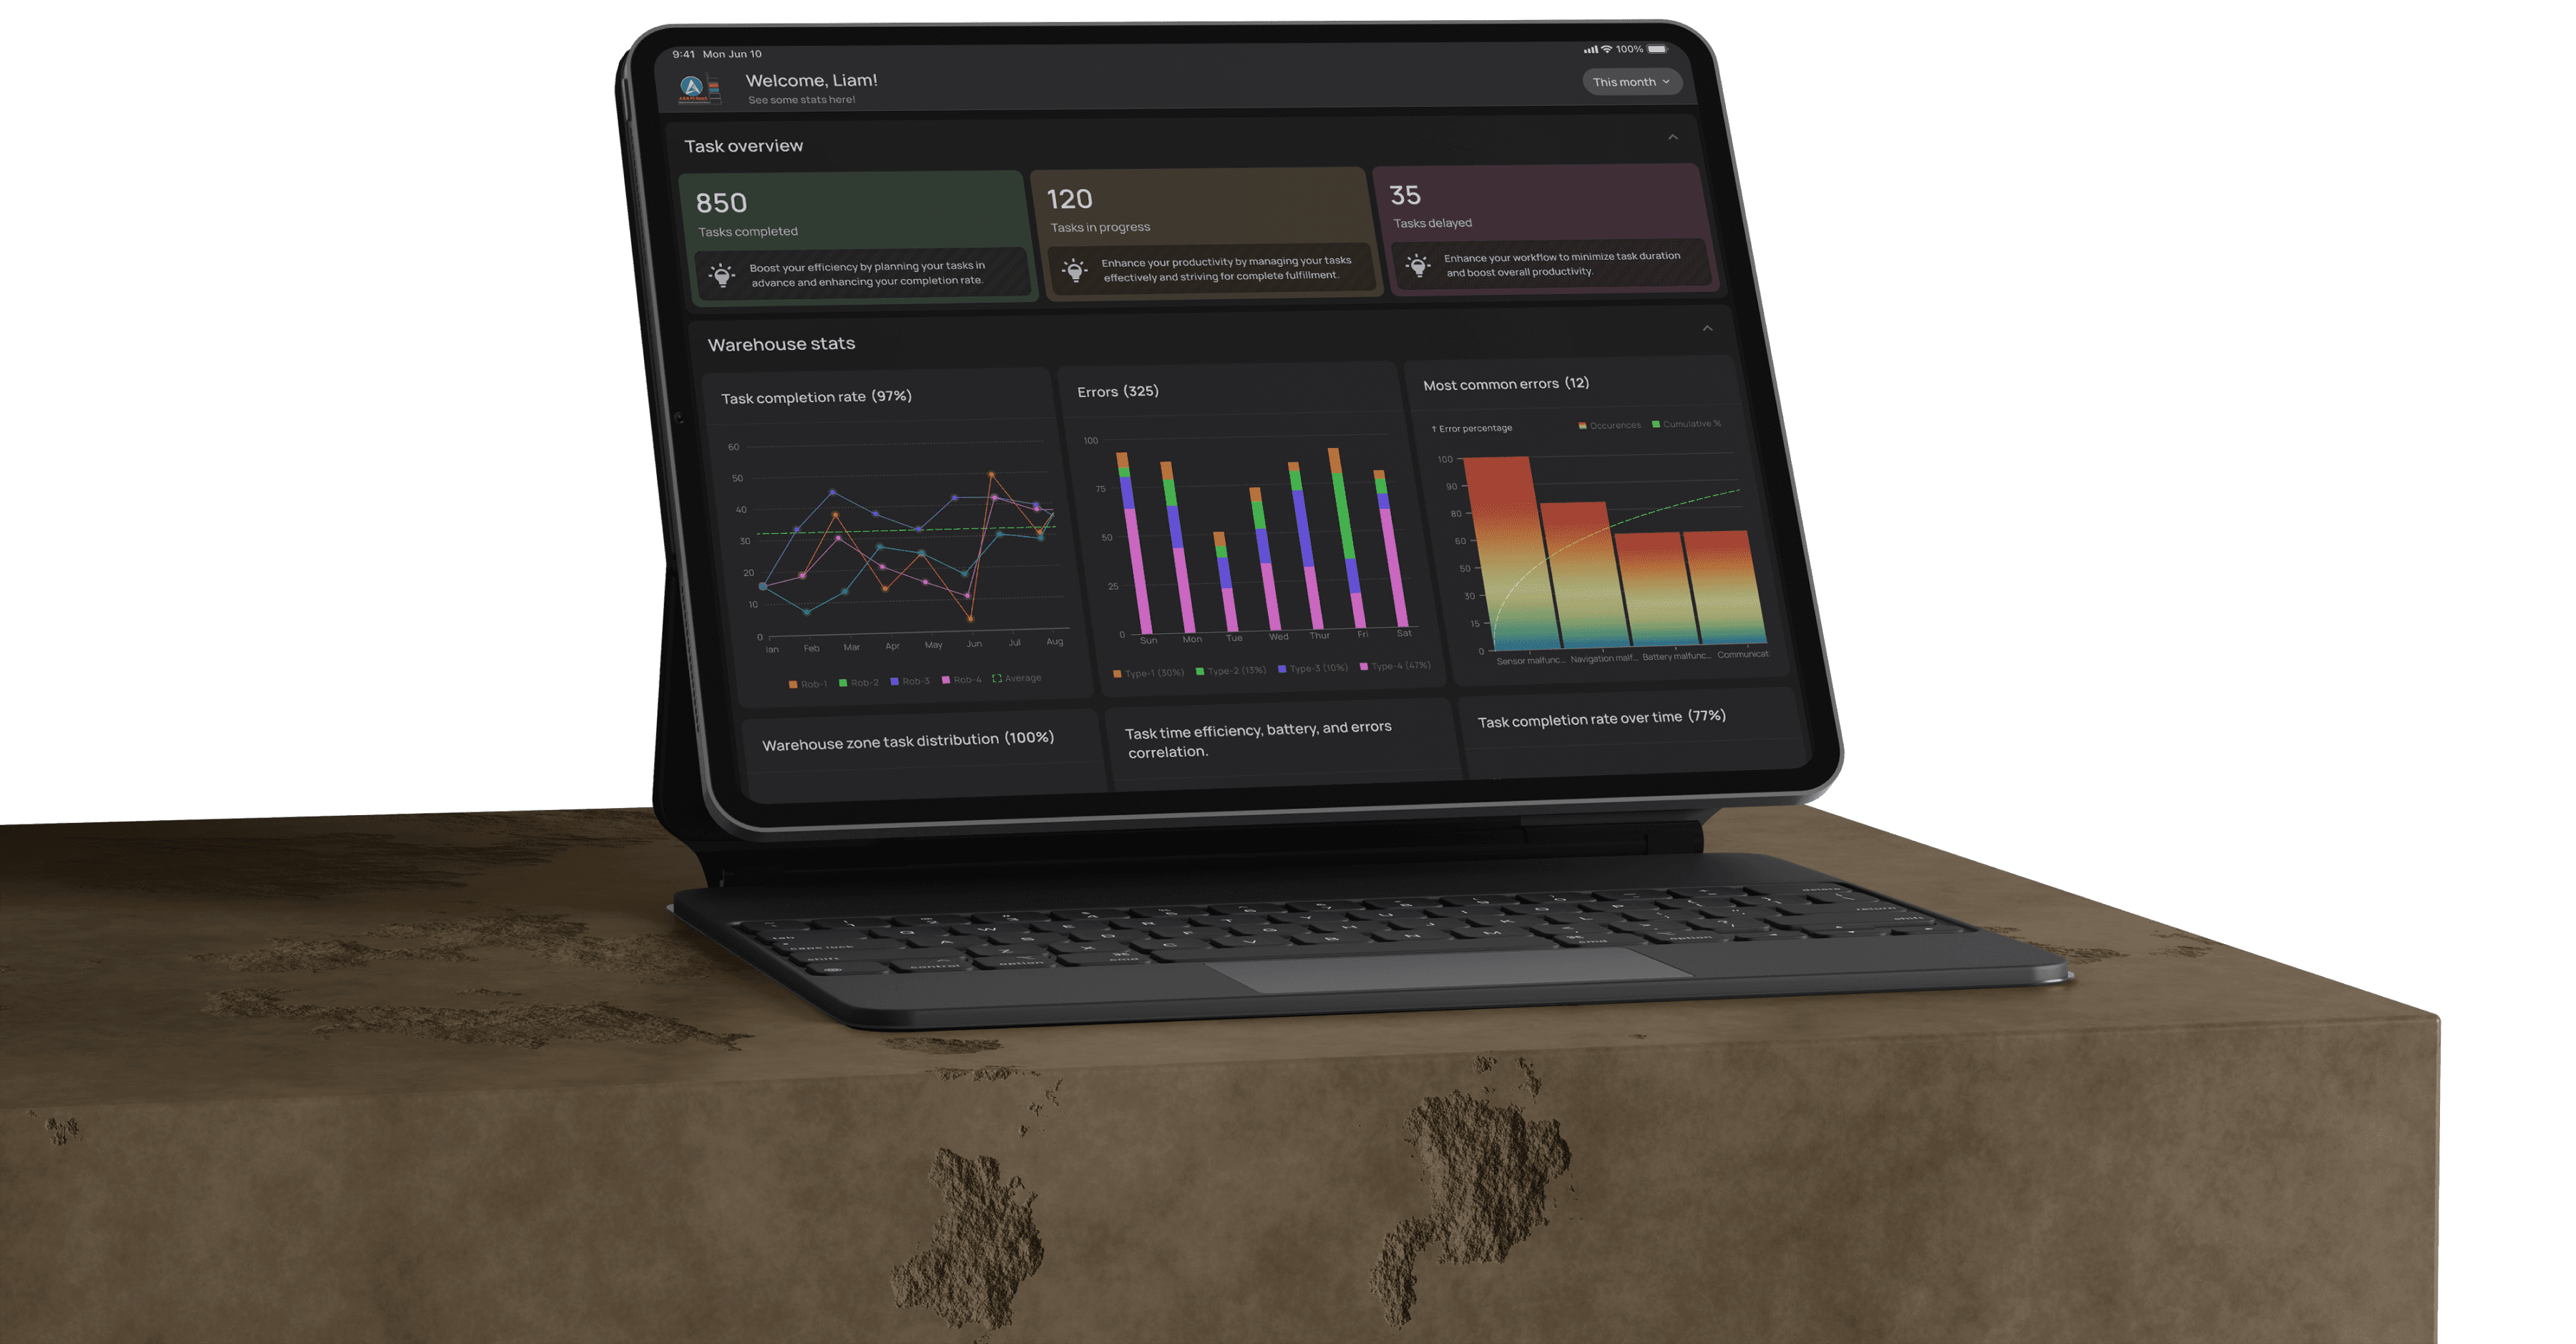
KPIs
Two dashboards, two time horizons
Don't merge live ops and analytics — they answer different questions. Live operations and retrospective analytics serve different decisions.
Live dashboard
Completed, in-progress, and delayed tasks for the current shift. To see what’s burning during the shift.
Problem solved
Shift progress was invisible unless a supervisor actively chased it — delays went unaddressed until too late.
Validation
Reduction in end-of-shift task backlog; supervisors intervene earlier on delays.


Problem solved
Post-shift reviews relied on memory and anecdote — no structured data to identify what actually went wrong or where.
Validation
Tuning decisions are made with data; improvement trends visible across shifts.
Inventory Map
Vector map


REFLECTION
What worked
Two months is tight for five modules at this depth. The system held together because of two principles — control surface for live operations and bird's-eye view of all operations — used as tie-breakers every time a screen could have gone two ways.
What I'd do differently
What I'd do differently: ship one module end-to-end before parallel-designing the rest. Some patterns I locked in early — the inline-edit table, the folder zone structure — only proved their weight in module four. Module one would have been simpler if I'd waited.